JOIN FELLOW EXHIBITORS AND REACH THOUSANDS
Below are the 2023 exhibitor demographics. Purchase your exhibit space beginning January 16 for Neuroscience 2024.
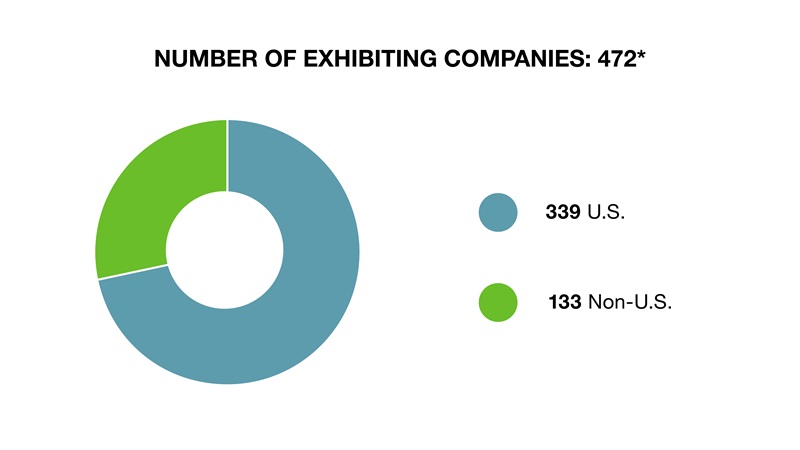
*2023 Exhibiting Organizations by Location:
Location
|
Number of Organizations |
| U.S. |
339 |
| Non-U.S. |
133 |
| Total |
472 |
↑ Back to top
2023 Exhibiting Organizations by Type:
| Type |
Number of Organizations |
Net Square Footage |
| Commercial |
387 |
73,400 |
| Nonprofit (includes SfN) |
75 |
9,400 |
| Government/Institute |
10 |
5,800 |
| Total |
472 |
91,300 |
↑ Back to top
2023 Exhibiting Organizations by Country:
| Country/Region |
Number of Organizations |
| Australia |
1 |
| Austria |
3 |
Belgium
|
4 |
| Canada |
19 |
| China |
9 |
| Denmark |
6 |
Finland
|
1 |
| France |
12 |
Germany
|
19 |
| Hungary |
2 |
| India |
1 |
| Ireland |
1 |
| Israel |
2 |
| Italy |
2 |
| Japan |
4 |
| Netherlands |
4 |
| Poland |
1 |
| Portugal |
1 |
| Serbia |
1 |
| South Korea |
6 |
| Singapore |
1 |
| Spain |
2 |
| Sweden |
2 |
| Switzerland |
7 |
| Taiwan |
2 |
| Turkey |
1 |
| United Kingdom |
22 |
| United States |
337 |
| Total |
472 |
↑ Back to top


